The age-old stock market adage has rang so true over the past year. The notion of “sell in May and go away” is based on the historical trend of relative underperformance by stocks during the period from May 1 to October 31. Of course, the flip side of this adage is the historical trend of relative stock outperformance during the period from November 1 to April 30. And as we put the first month of the latest “relative outperformance” phase behind us, what is the speculative appetite among investors to keep the buying going through April 2024?
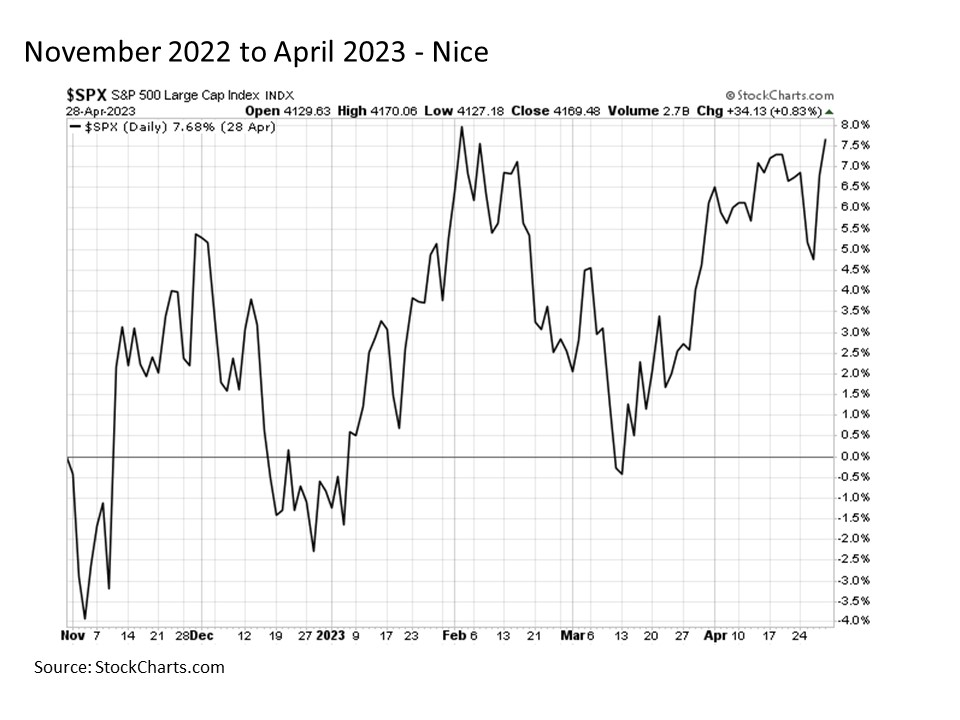
Adage in action. The S&P 500 set its latest bear market bottom on October 13, 2022. And over the subsequent period from November 2022 to April 2023, the headline benchmark index posted a cumulative positive return of nearly +8%. These positive results came despite the outbreak of a potentially major banking crisis toward the end of this stretch in March 2023 along the way.
The stretch from May to October ended up a bit more turbulent, as stocks travelled up one side of the mountain and back down the other. By the end of this less favorable six month stretch, stocks ended effectively flat.
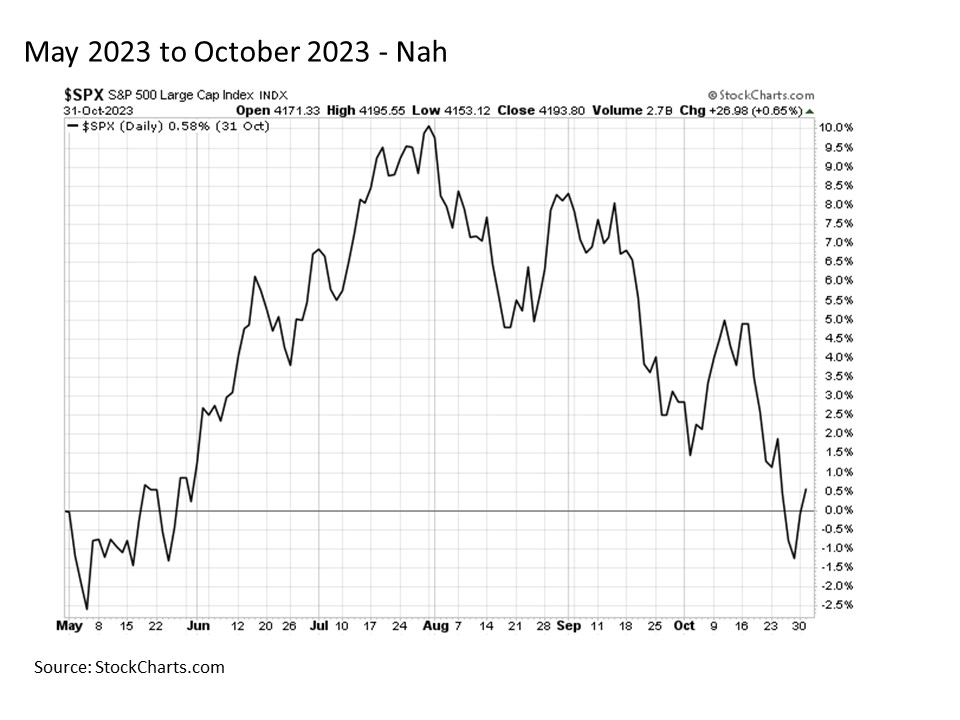
The adage held true again this year, but it’s important to reflect on the journey along the way to their respective end points. Yes, stocks soared by the time the November to April period came to a close, but the path was not without its extended bouts of downside volatility along the way. And while stocks ended up going nowhere from May to October, embedded in this journey was a plus +10% cumulative run to the upside. As a result, it is always important for investors to look deeper beyond the headlines, as the story is always far more nuanced than the end results might suggest.
Tis the season. We find ourselves today at the beginning of the latest semiannual cycle, and the results so far have been dramatic even by historical perspectives. The U.S. stock market just put a wrap on its third best November return performance in history, and stocks are holding their ground in December so far in consolidating some of these recent gains. But given that we’ve seen wild swings on the road to a positive ending as recently as last year, what are market signals telling us we should expect as we turn the corner into the New Year? We have a few notable positive signals in this regard.
Refreshed speculative appetite. The first positive development is signed of renewed speculative zeal that had otherwise been missing for much of the middle part of the year. While I wouldn’t be inclined to touch the category with a ten foot pole from an asset allocation modeling perspective, cryptocurrencies in general and Bitcoin in particular remain highly useful instruments to monitor from an investor risk appetite perspective. This perspective is best highlighted by the price relationship between the tech heavy NASDAQ 100 Index and Bitcoin, the latter of which is an asset that has no intrinsic value and is not backed by anything, and thus is a holding for the most speculative investors among us.
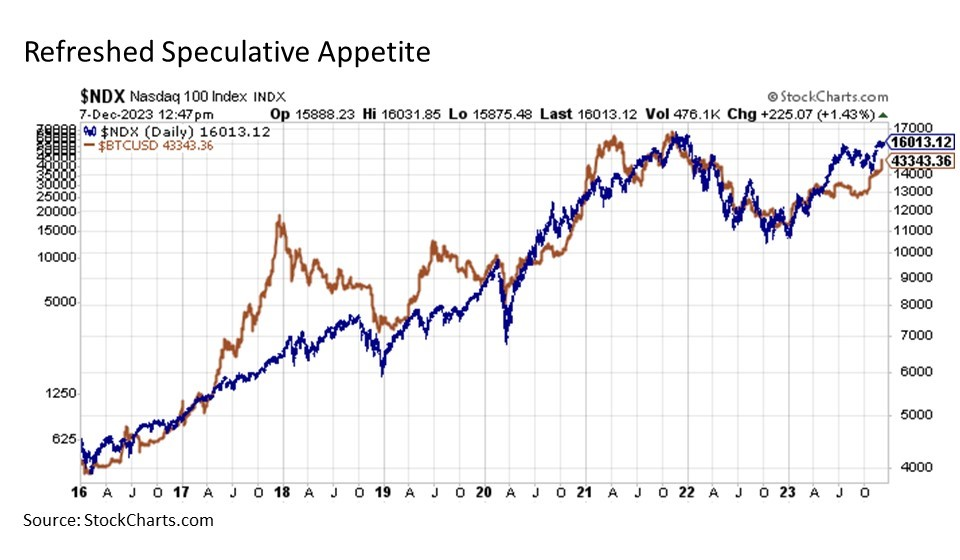
For nearly a decade, the path of the NASDAQ 100 has been very highly correlated with the price trajectory of Bitcoin. In instances when their paths have deviated, they have eventually reconverged. So when Bitcoin began fading lower in the spring at the same time that the NASDAQ 100 was spiking to the upside amid an AI mini bubble, it raised concerns that stocks may eventually fade and rejoin Bitcoin prices to the downside.
Fortunately for stock investors, the exact opposite has played out. Bitcoin prices have surged to the upside to catch up with the NASDAQ 100, supporting a continued move to the upside. And potentially more significantly from a market signaling perspective, it is worth noting that Bitcoin prices began rallying in early October, a few weeks before the stock market finally bottomed on October 30.
Spreading good cheer. Another increasingly positive development is the steadily broadening market participation. Through November, one notable point of concern was that a relatively smaller percentage of stocks were driving the market higher. But as we continue into December, we are seeing a broader array of stocks participating to the upside.
This development has been particularly notable among U.S. small cap stocks, which have been long out of favor relative to their large cap brethren. Small caps rallied strongly from their October lows, but emerging from the end of November, they remained trapped up against their 200-day (red line) and 400-day (pink line) moving average lines. Thus, one of the keys to watch entering December was whether small caps could follow through and breakout above these key resistance levels.
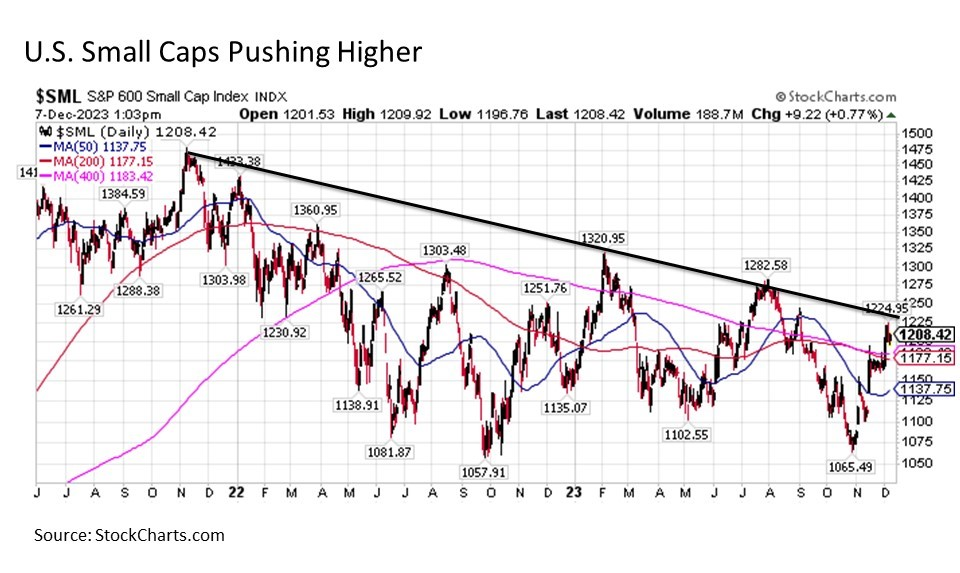
The good news is that small caps have since decisively broken to the upside. The next key to watch is whether the S&P 600 Small Cap Index can continue its climb and breakout above a downward sloping trendline dating back to the broader market highs at the start of 2022. A decisive move above these levels could suggest a major broadening reversal trend continuing well into 2024.
Coming closer together. A third positive sign suggesting upside support for stocks in the months ahead is ongoing trends in the yield differential between U.S. Treasuries and comparably dated high yield corporate bonds, otherwise known as the spread. When this spread is low, or tight, it signals that investors do not require much of an additional yield premium for taking on the additional risk of owning bonds that have a meaningfully higher probability of default. Why does this matter to stocks? Because if investors feel more comfortable taking on the risk of owning the bonds of companies that have a higher default risk, then they are just as likely to feel comfortable taking on the risk of owning stocks. The converse is also true – wider spreads, greater risk aversion.
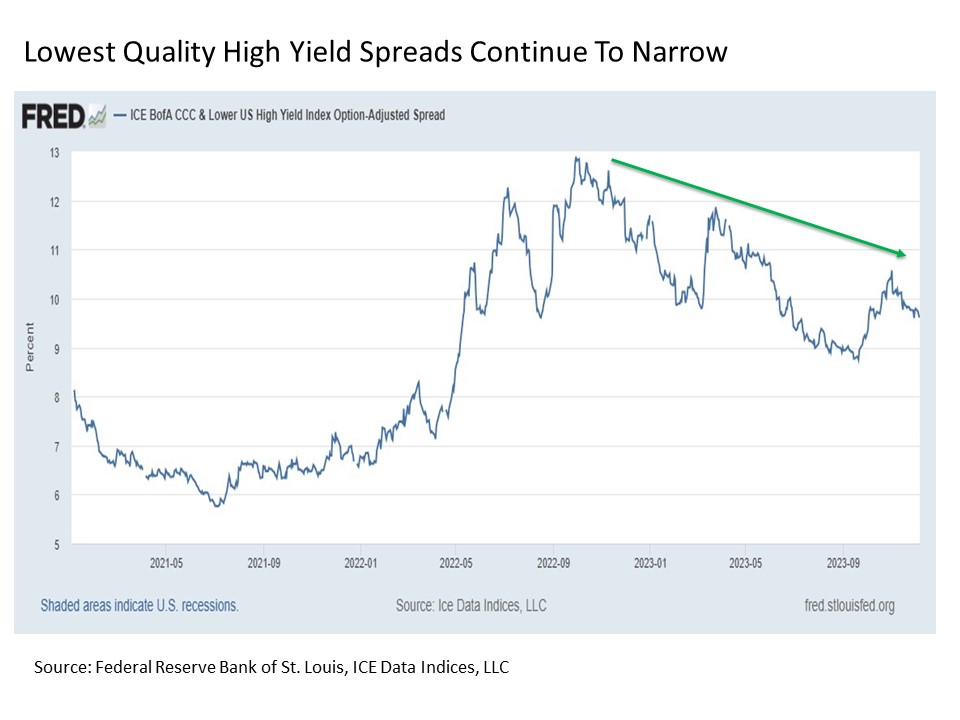
So what are we seeing today? When looking at high yield spreads, I like to focus on the CCC and lower rated space. Why? Because if investors are even starting to feel jittery about taking on risk, it is with the lowest quality securities where we will very likely see this sentiment manifest first. And over the past year, we have seen CCC and lower spread continue on a narrowing trend. Even following the recent mini spike in spreads during the August to October correction, the trend has returned to the narrowing path. These are positive developments from a speculative risk taking perspective.
Bottom line.We are now well into a seasonally favorable time of year for capital markets. And while we may see bouts of downside volatility along the way, a variety of signals are supportive of a favorable speculative backdrop and further upside ahead in risk assets.
Disclosure: I/we have no stock, option or similar derivative position in any of the companies mentioned, and no plans to initiate any such positions within the next 72 hours. I wrote this article myself, and it expresses my own opinions. I am not receiving compensation for it. I have no business relationship with any company whose stock is mentioned in this article. Investment advice offered through Great Valley Advisor Group (GVA), a Registered Investment Advisor. I am solely an investment advisor representative of Great Valley Advisor Group, and not affiliated with LPL Financial. Any opinions or views expressed by me are not those of LPL Financial. This is not intended to be used as tax or legal advice. All performance referenced is historical and is no guarantee of future results. All indices are unmanaged and may not be invested into directly. Please consult a tax or legal professional for specific information and advice.
Compliance Tracking: #514426-1
