“Look beneath the surface; let not the several quality a thing nor its worth escape thee.” – Marcus Aurelius
The gains in the U.S. stock market keep on coming. This includes the headline benchmark S&P 500, which is now up over +7% year to date with seemingly any and all dips (Tuesday this week) almost immediately being bought (Wednesday this week). But remembering that the U.S. stock market is a market of individual stocks, it is worthwhile to look beneath the surface of the market to better understand what exactly is driving stocks higher and where budding opportunities may lie.
Sector breakdown. One way to look beneath the market surface is to examine performance by sector. For this purpose, we will more closely examine the eleven Global Industry Classification Standard (GICS) sectors: energy, materials, industrials, consumer discretionary, consumer staples, health care, financials, real estate, information technology, communication services, and utilities.
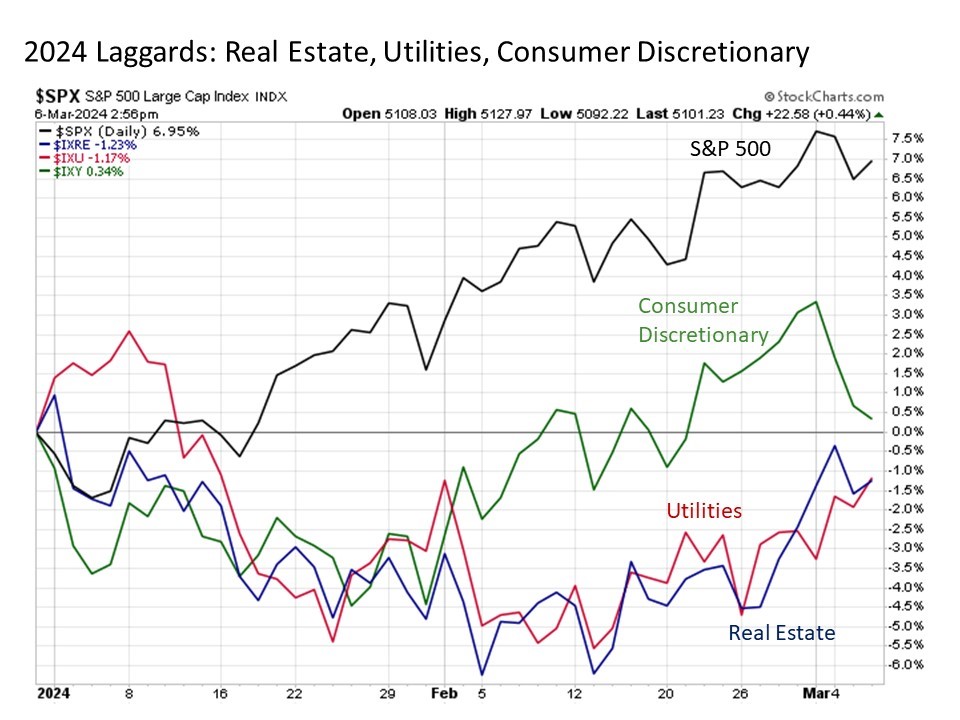
Laggards. Let’s begin with a brief look at the laggards, or those sectors that are meaningfully underperforming the broader S&P 500 so far this year. This list should come as no surprise, with both real estate and utilities posting marginally negative returns year to date.

What accounts for these trailing results so far? Neither sector was necessarily discounted heading into the year, and both are more interest rate sensitive and are feeling the effects more directly from the reality that the U.S. Federal Reserve is not likely to cut interest rates nearly as much as investors hoped heading into the year.
For what it’s worth, while both sectors are trailing badly for the year, they have marginally outperformed the broader S&P 500 since February 13. This, not coincidentally, is right around the time that the 10-Year U.S. Treasury yield first peaked above 4.3% before starting to make its way back down toward 4.1%. Thus, investors should be mindful of forces driving interest rates when considering potential opportunities in these sectors.
What about consumer discretionary, which is nearly flat year to date? It’s not nearly as bad as it looks on the surface unless, of course, you are an investor in Tesla, which made up as much as 18% of the sector weight at the start of the year and is down -28% year to date. Take out Tesla, and consumer discretionary returns are more in line with the broader market.
Liners. Before getting to the hot stuff, a few words about those sectors that are performing generally in line with the market if not off a few steps so far this year.
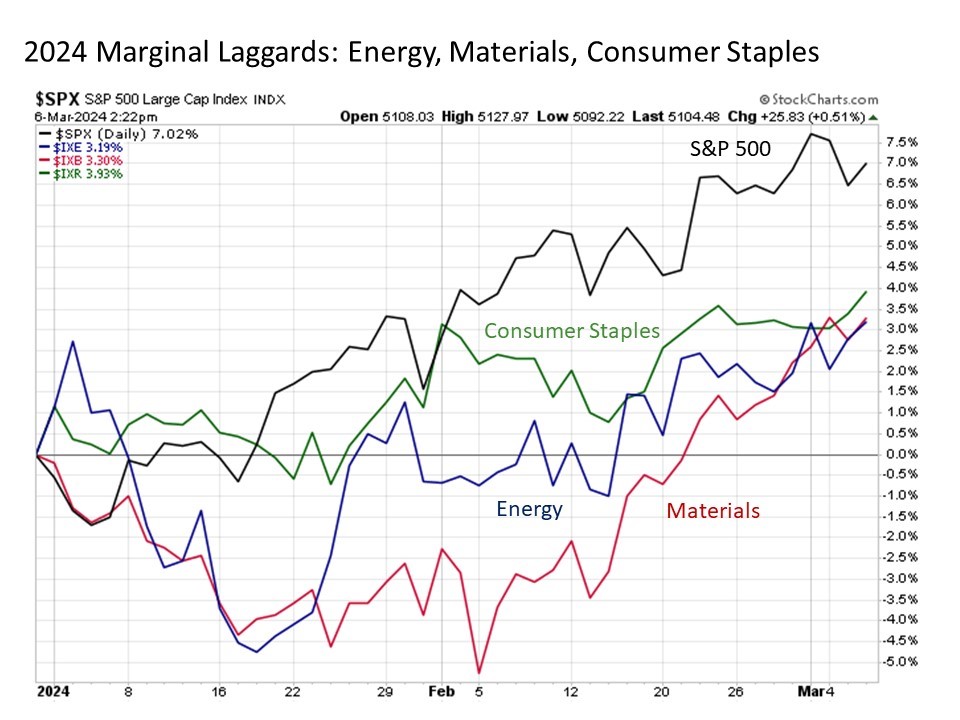
Let’s start with the marginal laggards. This includes energy, materials, and consumer staples, each of which are up between +3.8% to +4.5% year to date.

Lackluster results indeed in a broader market that is up over +7% so far this year. But a couple of details upon closer inspection are worth note. Let’s start with energy – since January 18, the energy sector has picked up the pace and performed in line with the S&P 500. How about materials – after a bumpy first month of the year, the materials sector has posted a return more than double that of the S&P 500 since February 5. Both of these sector resurgences highlight the fact that the market is almost always in a state of internal rotation beneath the surface, as today’s laggards can become tomorrow’s leaders.
What about consumer staples? It’s been doing its typical defensive, consistent, consumer staple-y thing so far in 2024. Steady results that are trailing in an up market but with lower overall price volatility.
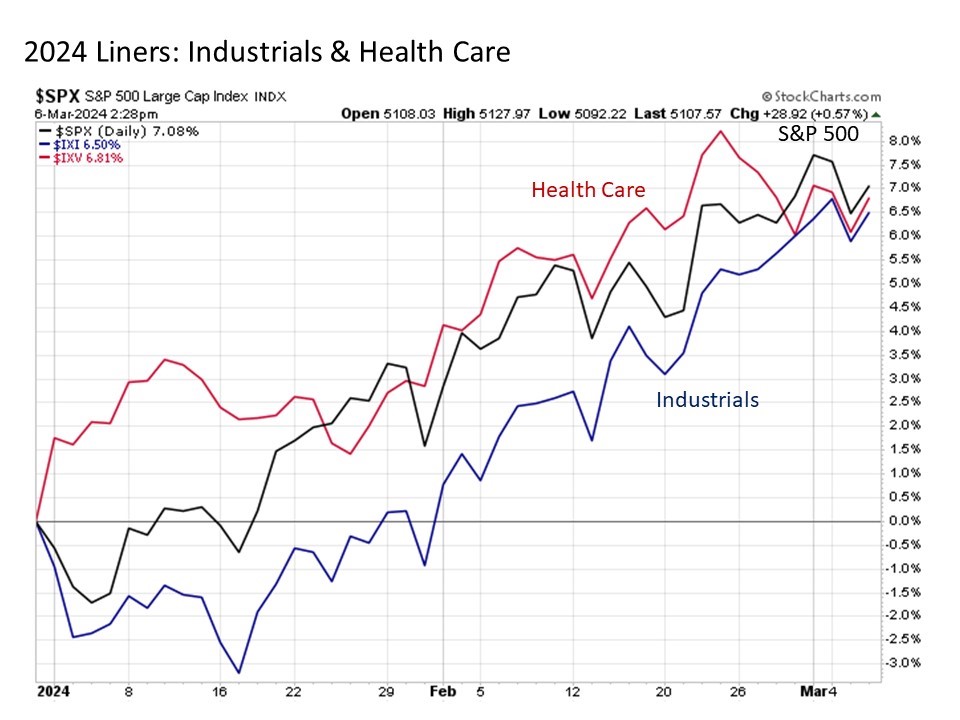
Next up in the in line group are health care and industrials, both of which are only slightly below the S&P 500 returns for 2024 but have been tracking closely along the way.

Starting with health care, it jumped strongly in the first two weeks of the year before regressing its way back to the broader market trend. Value and opportunity continue to await investors in this area of the market, but it continues not to differentiate meaningfully to date this year.
Moving on to industrials, much has been made in the financial media recently about the notable surge in industrial sector leadership over the last two months. But this performance should be put into broader context before jumping to any conclusions. Yes, industrials are higher by nearly +10% since January 17, which is notably ahead of the S&P 500 pace over the same time period, but the sector had a notably lousy start to the year prior to its recent run. As a result, it could be strongly contended that the recent spurt in industrials has been more a regression to the broader market mean than the beginning of a longer outperformance trend. This is particularly likely when considering industrials, which is the sector out of the eleven whose returns are most closely correlated to the broader S&P 500 over long-term periods of time.
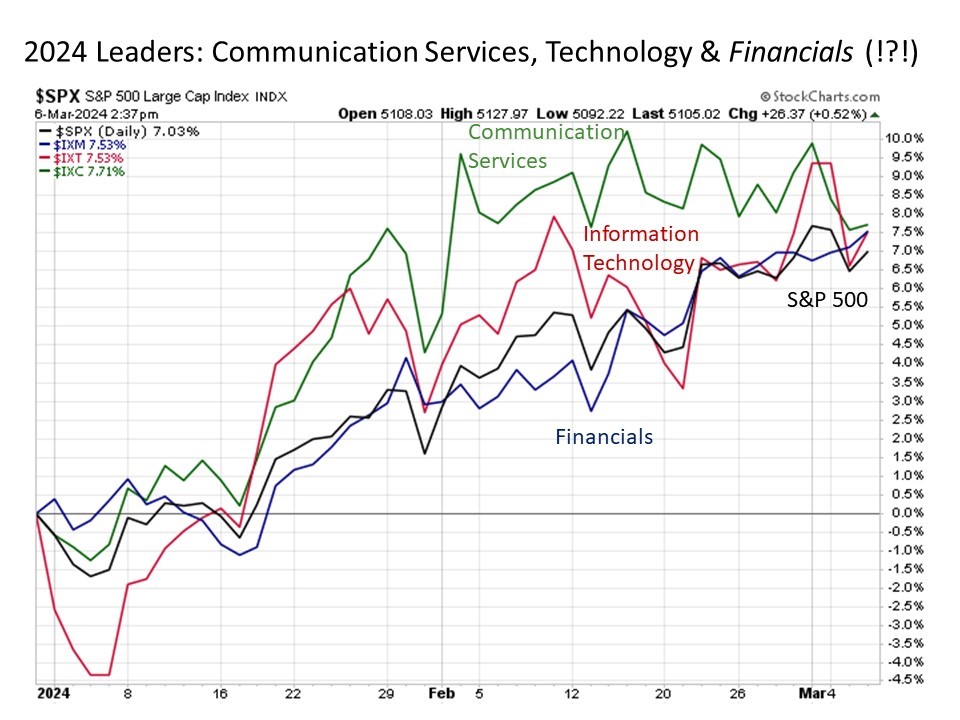
Leaders. Let’s turn our focus now to the favorites of the market so far in 2024, which are shown below.

We’ll start with the seeming shocker on the list. Only three sectors are beating the returns of the S&P 500 year to date, and one of them is financials? This sets into motion all kinds of narratives about banks defying the disappointment of evaporating Fed rate cuts and visions of stabilizing balance sheets and strong loan growth demand. But it’s not what you might think. Sure, major banks such as JP Morgan Chase is outperforming the S&P 500 so far this year, and Wells Fargo has flown out of the ashes since February 13 to now lead the broader market in 2024, but the overall bank index is barely higher so far this year and the regional bank index was lower by double-digits year to date up until a couple of days ago. In short, it’s not banks that are leading the financial sector. Instead, it is financial conglomerates like Berkshire Hathaway and up until 2023 former tech sector payment processing companies like Visa and Mastercard that are driving sector outperformance.
The remaining two are no surprise, as the narrative of information technology and communication services leading the market. Perhaps the only notable difference in the outperformance this year so far versus last year is that leadership within these sectors has broadened somewhat from the mega cap names that dominated to the upside last year.
The characteristics of this market leadership raise an important point as we continue through the remainder of the first quarter and beyond. For all of the talk in the financial media about potential and arguably long overdue sector rotation taking place within the U.S. stock market, yesterday’s leading sectors continue to be today’s leading sectors, even if some of the underlying constituents have recently changed sector jerseys along the way. And one should not draw any conclusions about this shift in leadership actually taking place until they’ve looked beneath the market surface and verified it for themselves.
Bottom line. While U.S. stock market performance continues to shine in 2024, it remains worthwhile as always to look beneath the surface in examining details like sector performance as well as going deeper into the specific sector constituents that may be driving sector performance at any given point in time to better understand the dynamics driving the market. And today, information technology and friends continue to lead.
Disclosure: I/we have no stock, option or similar derivative position in any of the companies mentioned, and no plans to initiate any such positions within the next 72 hours. I wrote this article myself, and it expresses my own opinions. I am not receiving compensation for it. I have no business relationship with any company whose stock is mentioned in this article. Investment advice offered through Great Valley Advisor Group (GVA), a Registered Investment Advisor. I am solely an investment advisor representative of Great Valley Advisor Group, and not affiliated with LPL Financial. Any opinions or views expressed by me are not those of LPL Financial. This is not intended to be used as tax or legal advice. All performance referenced is historical and is no guarantee of future results. All indices are unmanaged and may not be invested into directly. Please consult a tax or legal professional for specific information and advice.
Compliance Tracking #: 550850-1
