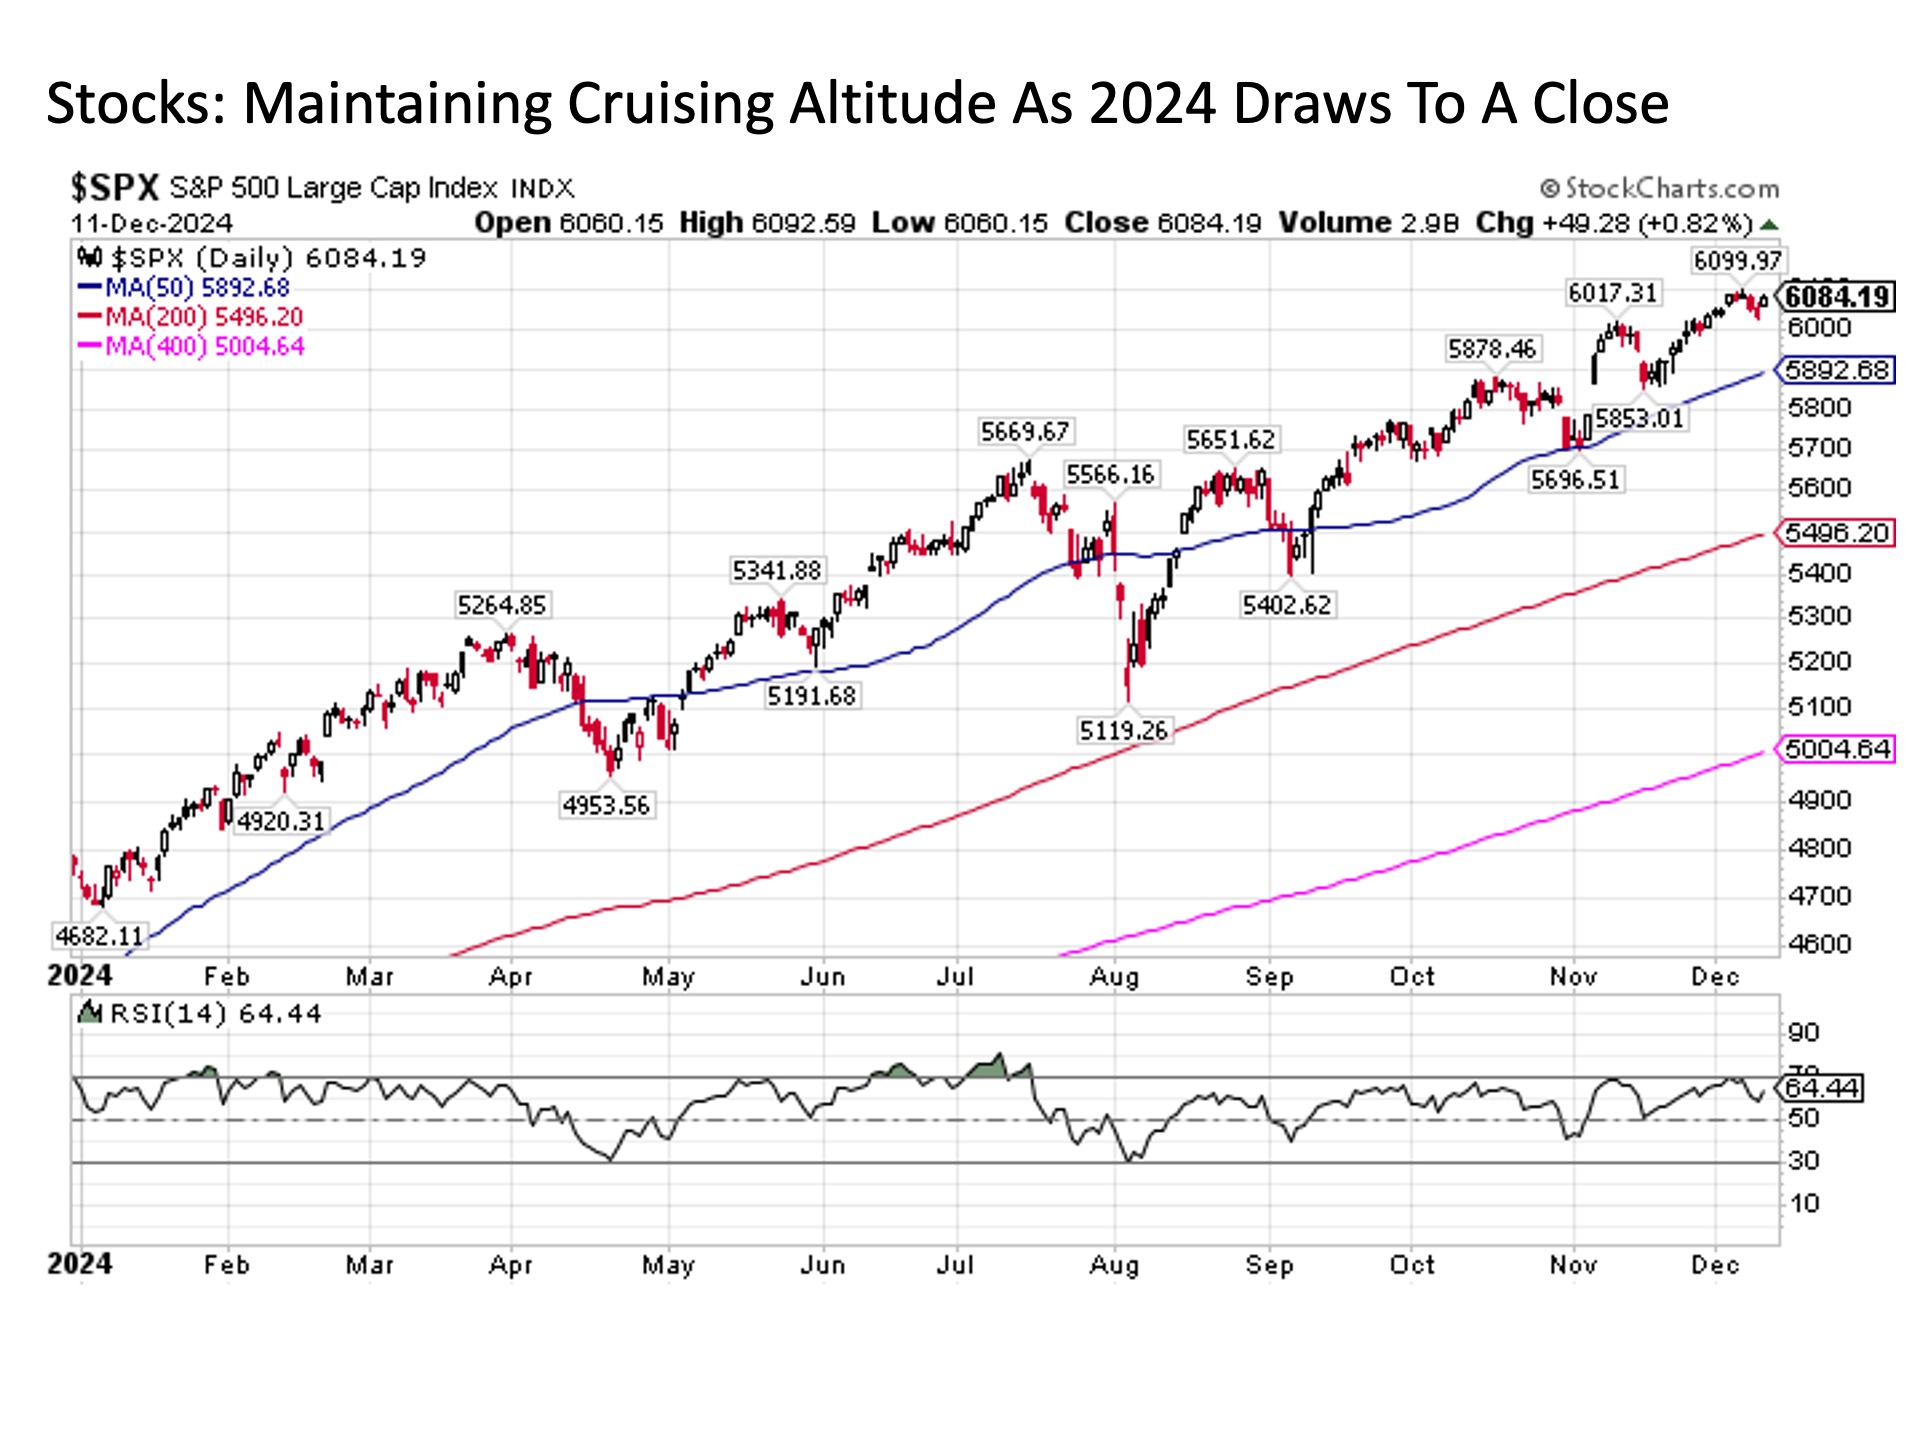
It has been a phenomenal year for the U.S. stock market in 2024. The S&P 500 was still trading below 4800 emerging from what had been a strong 2023, and while a good year ahead was anticipated, the idea of the benchmark index cresting 6000 to close out 2024 seemed a long shot at best. But as we move through the final three weeks of December, the S&P 500 managed to notch its first 6000 reading more than a month ago now and has 6100 if not 6200 in its sight by the time the ball drops in Times Square. With such a steadily robust performance throughout 2024, what could possibly go wrong as we enter 2025?
Santa Claus is coming to Wall Street. First, it is important to remember that we are now entering what is seasonally the most wonderful time of the year for stocks. If one scrubs what took place in late 2018 from their memory, this is a time when institutional traders start to close their books on the calendar year and trading volume starts to lighten. At the same time, retail traders filled with yuletide cheer and stockings stuffed with bonus cash from their employers among other things take to their brokerage accounts and search for stocks to buy.
While the true “Santa Claus effect” trading period is typically runs from the last few trading days in December through early in the New Year, overall the period from right around Thanksgiving through the start of the second full week in January has historically been a stock market friendly time of year. And with economic estimates for GDP growth continuing to steadily climb supporting forecasts for double digit corporate earnings growth in the year ahead at a time when inflationary pressures remain in check and the U.S. Federal Reserve is cutting interest rates, we have good reason to believe that the 2024 holiday season will be no exception in this regard. (Why was 2018 an exception as noted above? Because by contrast the U.S. Federal Reserve was raising interest rates at a time when the U.S. economy was slowing and most of the rest of the world was already well into a bear market – not at all so today).
Flying high again. This is all good news so far for seemingly the next month or so, but what about once the traditional holiday stock buying binge period subsides come the first or second week of January 2025. What then should we reasonably expect?
First, it is important to remember that while the economic and corporate earnings outlook is as rich as pecan pie, stock valuations have also risen beyond nosebleed levels. For example, the S&P 500 that historically has traded around 16 times GAAP earnings throughout its history and toward 22 times earnings during the “Fed put” era since 1987 is currently trading just north of 30 times earnings today. This represents a near 40% premium to its four decade average and nearly double its long-term multiple. In short, stocks today remain priced beyond perfection. Now this is all fine and dandy as long as net positive liquidity continues to flow into financial markets (see the price of Bitcoin as a good barometer for indiscriminate liquidity inflows among other readings). But the give back can be ruthless for premium valued stocks once the liquidity tide turns to the negative (stock valuations do not matter until they suddenly do . . . A LOT). This principle will be a key theme that we will be monitoring as we enter and throughout 2025 in future GVA Economic & Market Reports.
Next, it is important to note even if liquidity flows remain positive into financial markets that U.S. large cap stocks are long overdue for a correction. There was a reason for skepticism entering 2024 that the S&P 500 could reach much less surpass 6000 by the end of this year. That’s because stocks typically don’t rise in a straight line. Instead, they usually advance in an oscillating two-steps-forward-one-step-back pattern where strong advances are followed by periodic pullbacks. But the periodic pullbacks have been absent this year outside of very brief stints in April and the start of August. As a result, the S&P 500 has elevated into a cruising altitude well above its various price trend lines. Knowing that the laws of gravity have not been repealed, it is only a matter of time before investors collectively find some sort of excuse to take at least some profits off the table for a stretch following what has been a tremendously strong run.

Air pockets. Putting this all together, we should not be surprised at all despite all of the underlying positive economic and market fundamentals to see the S&P 500 enter into some sort of correction in the first quarter of 2025 into the early spring that could last anywhere between four to twelve weeks and take a solid slice off the S&P 500 in the process.
What would the depth of such a correction likely look like under current conditions all else equal (in other words, assuming that some exogenous shock or idiosyncratic event does not pop up along the way)? The S&P 500 stock price trendlines provide a reasonable guide.
For example, the S&P 500 that closed on Wednesday at 6084 could drop by more than -3% to its medium-term 50-day moving average currently at 5892 (the blue line in the chart above) and would have simply regressed to upward trendline support (notice how the S&P 500 has repeatedly bounce off of this trendline in May, September, and November of this year in continuing its rise.
Next, the S&P 500 could drop nearly -10% from current levels – the technical definition of a stock market correction in many corners – to currently 5496 and have done nothing more than regressed to its long-term 200-day moving average trendline (the red line in the chart). Put simply, we could lop a solid -10% off the S&P 500 today and the broader bull market uptrend in stocks would remain fully intact.

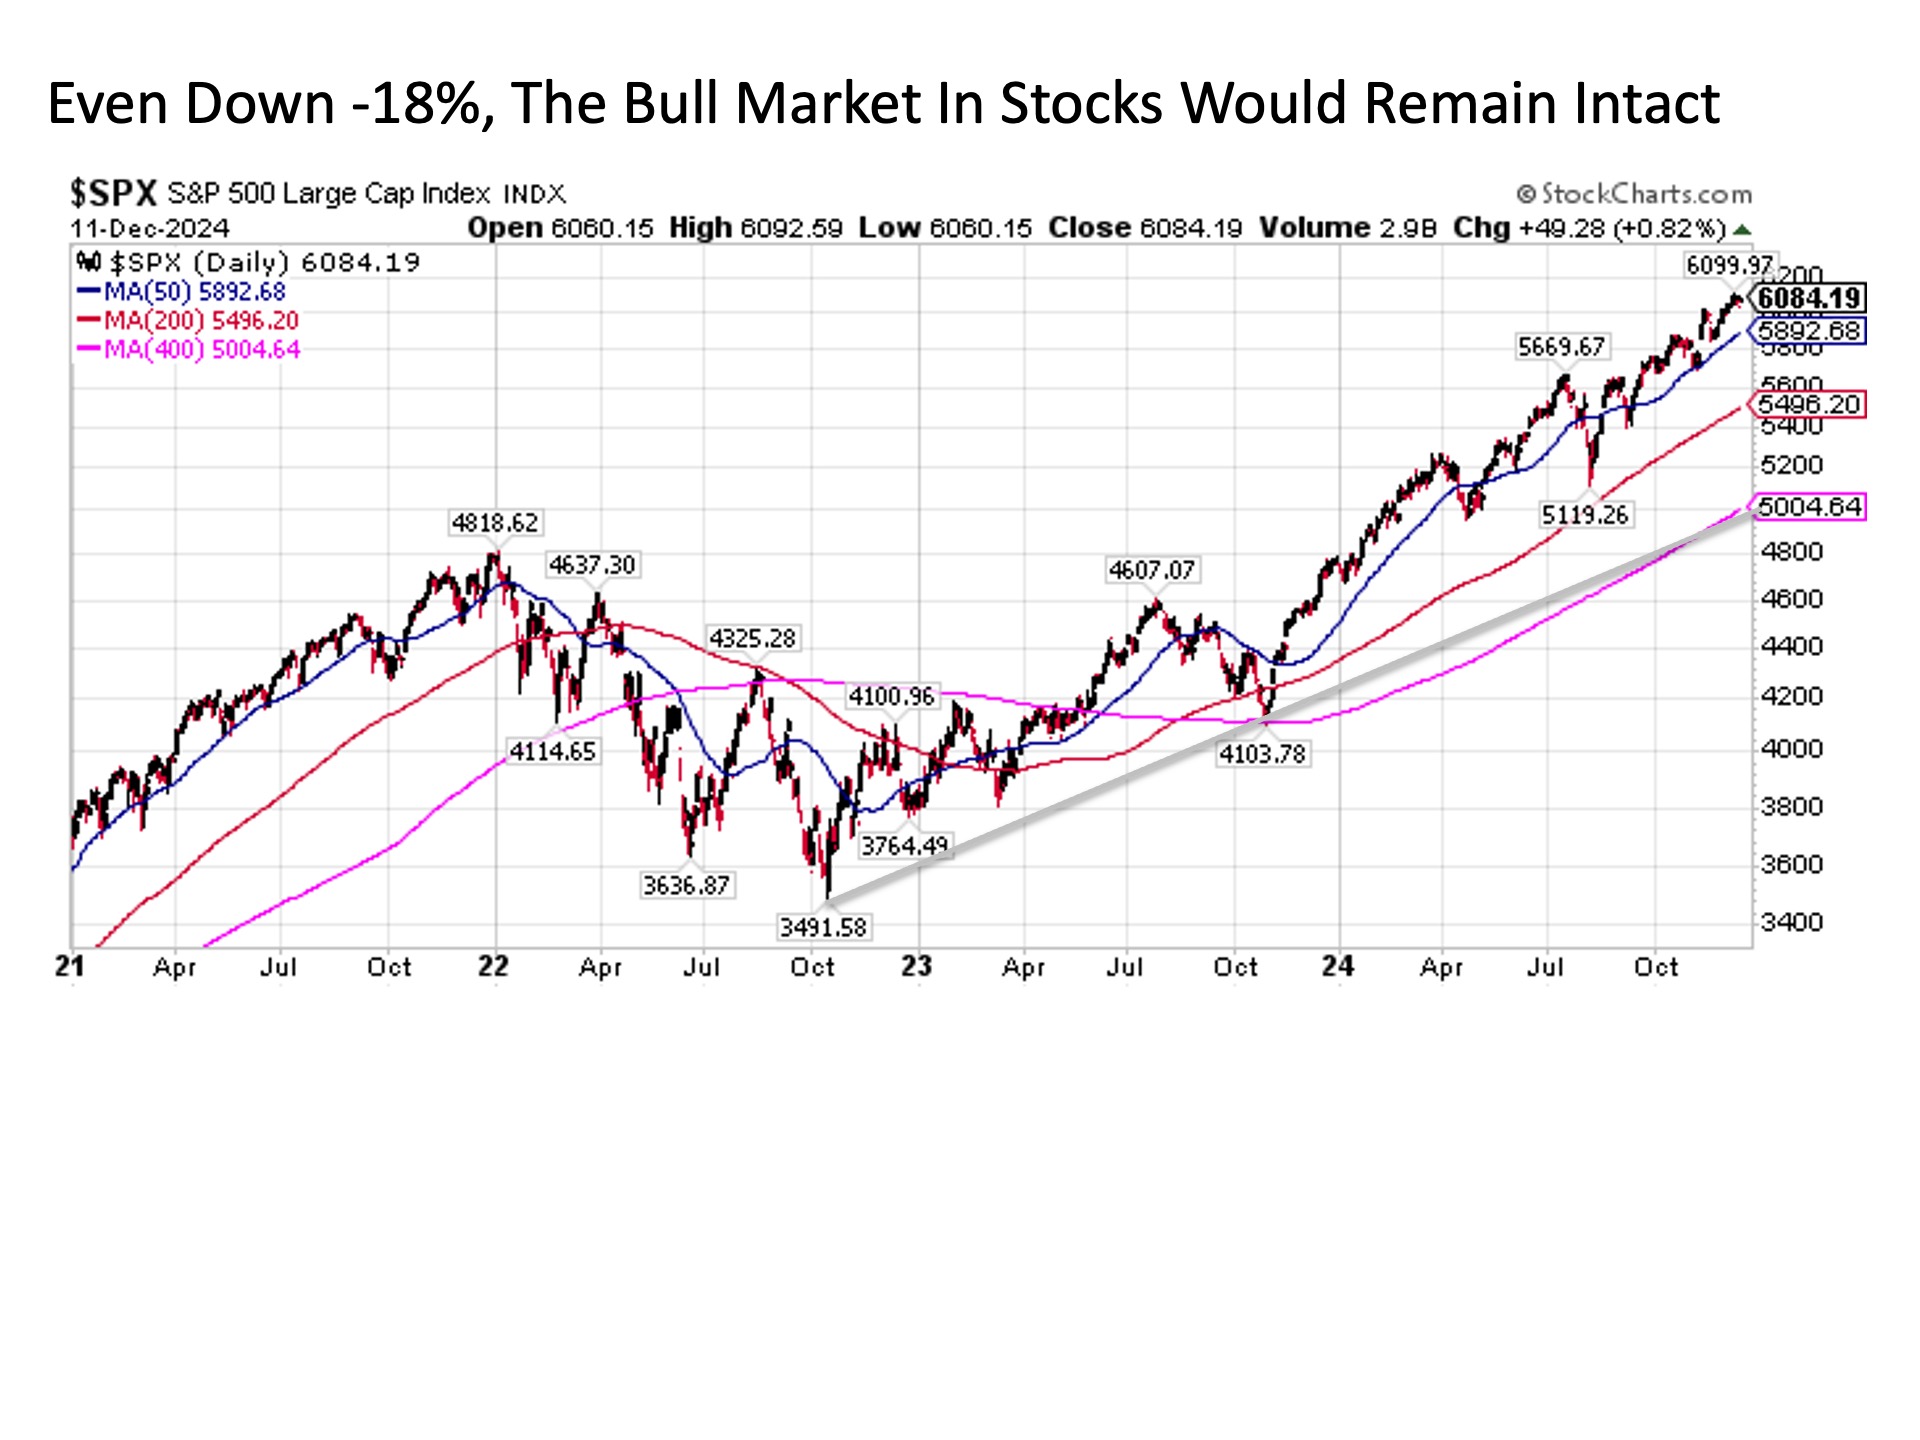
Let’s go one final step further. Let’s suppose the S&P 500 dropped by nearly -18% from current levels to its 400-day moving average (pink line in the charts above) that just crossed above 5000 for the first time a few days ago. This is more than 1000 points coming off of the S&P 500 Index in this scenario. Despite what looks like a staggering and potential worrying decline, such a move would represent nothing more than the stock market regressing to its ultra long-term trendline that is trending decisively higher in its own right. Yes, we could drop -18% over a four to twelve week period in early 2025, and the bull market in stocks dating back to its October 2022 lows would still be very much intact. Buying opportunity on the dip anyone?
Bottom line. It’s been a phenomenal year for stocks throughout 2024, and the fundamental economic and market set up remains highly constructive as we enter 2025. But risks do remain, and we as investors should remain prepared for the fact that we remain overdue for another inevitable periodic pullback that takes place in even the most raging bull markets. At such great heights today, such a correction in early 2025 could prove measurable in excess of -10% before its all said and done. But barring some unforeseen development along the way, any such short-term decline in stock prices should be viewed as a potentially attractive buying opportunity and not a reason to sell.
I/we have no stock, option or similar derivative position in any of the companies mentioned, and no plans to initiate any such positions within the next 72 hours. I wrote this article myself, and it expresses my own opinions. I am not receiving compensation for it. I have no business relationship with any company whose stock is mentioned in this article.
Investment advice offered through Great Valley Advisor Group (GVA), a Registered Investment Advisor. I am solely an investment advisor representative of Great Valley Advisor Group, and not affiliated with LPL Financial. Any opinions or views expressed by me are not those of LPL Financial. This is not intended to be used as tax or legal advice. All performance referenced is historical and is no guarantee of future results. All indices are unmanaged and may not be invested into directly. Please consult a tax or legal professional for specific information and advice.
Compliance Tracking #: 670636-1
