The stock market dominates the headlines, and understandably so. The S&P 500 has been a stellar performer for years, and the last nine months last year have been no exception, having surged as much as nearly +40% trough to peak since late October. But while stocks own the spotlight, other key unsung asset classes have also been performing their roles admirably in recent months.
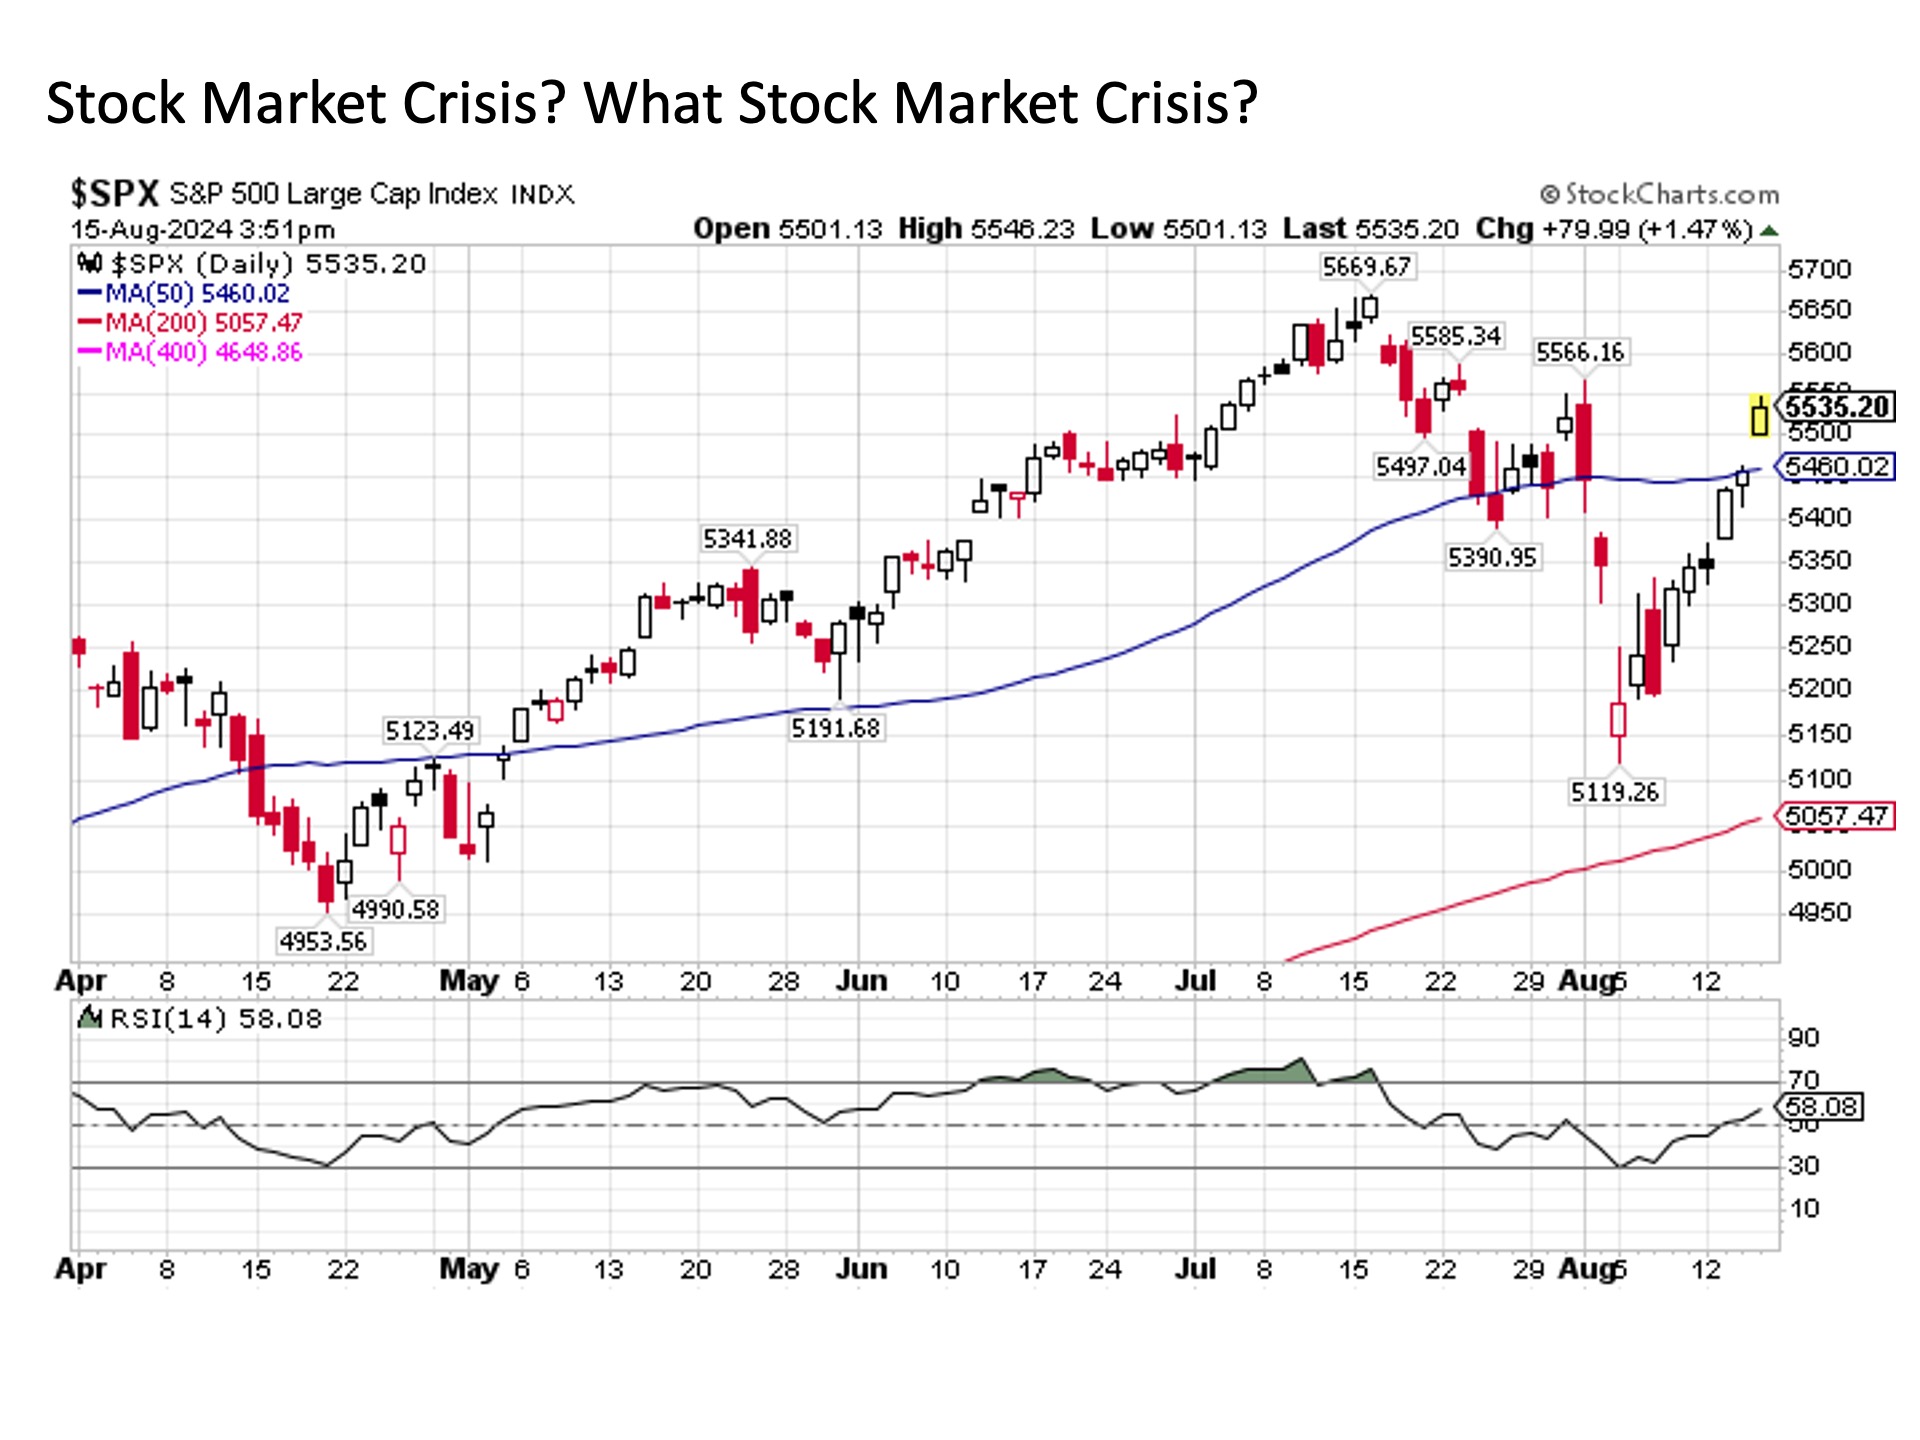
Stocks. First, a quick update. It was less than two weeks ago that global capital markets were suddenly rattled by the unwind of the yen carry trade. Although stocks were already descending from their July 16 peak, a sharp three day sell-off on August 1, 2, and 5 saw the S&P 500 plunging more than -8%.
Normally when stocks bottom following such a sharp sell-off driven by an mechanical investment market shake up, they typically swing back and forth in the subsequent days, as fierce rebounds are mixed with sudden and sharp downside reversals as institutions that were caught offsides on a trade gone wrong but weren’t forced to sell in the initial outbreak work to find their way to the exits in these positions to reduce downside risk exposure. But what we have seen in the days since last Monday has been anything but.
Instead, the S&P 500 has rallied smartly in seven out of the last eight trading days since the Monday lows (the headline index did roll over once last Wednesday, but that’s about it). This is an impressive recovery from what looked like a perilous state for stocks just over a week ago and highlights how resilient today’s market remains even in the face of economic, financial, and market pressures. This bodes well for potential continued equity market gains in the months ahead through Thanksgiving.

Could we see some consolidation in the coming days following the recently strong advance? Absolutely, particularly as the S&P 500 has rebounded so quickly and has blasted its way back above its 50-day moving average in the process. But even if we see any short-term consolidation, the path of least resistance for stocks continues to be to the upside.
Bonds. If you were a stock investor at the start of August, you may have found yourself internally freaking out for a minute or two as stock prices cut sharply to the downside. But if you were a bond investor during this same time period, you likely had good reason to be thrilled with how your portfolio was responding, as the investment grade segment of the fixed income market was registering solid gains as equities were cascading to the downside.
Leading among these was long-term U.S. Treasuries, which rallied more than +3% as the S&P 500 was falling by more than -8%. Such is the diversification benefit provided by the bond market in certain market environments.
Notably, the spurt of long-term Treasury outperformance to start August is nothing new. In fact, if one went back to late April of this year, we see that the long bond is higher by more than +12% versus the S&P 500 that has gained just +8% over this same time period. This is recent leadership that flies under the surface in today’s stock dominated marketplace.

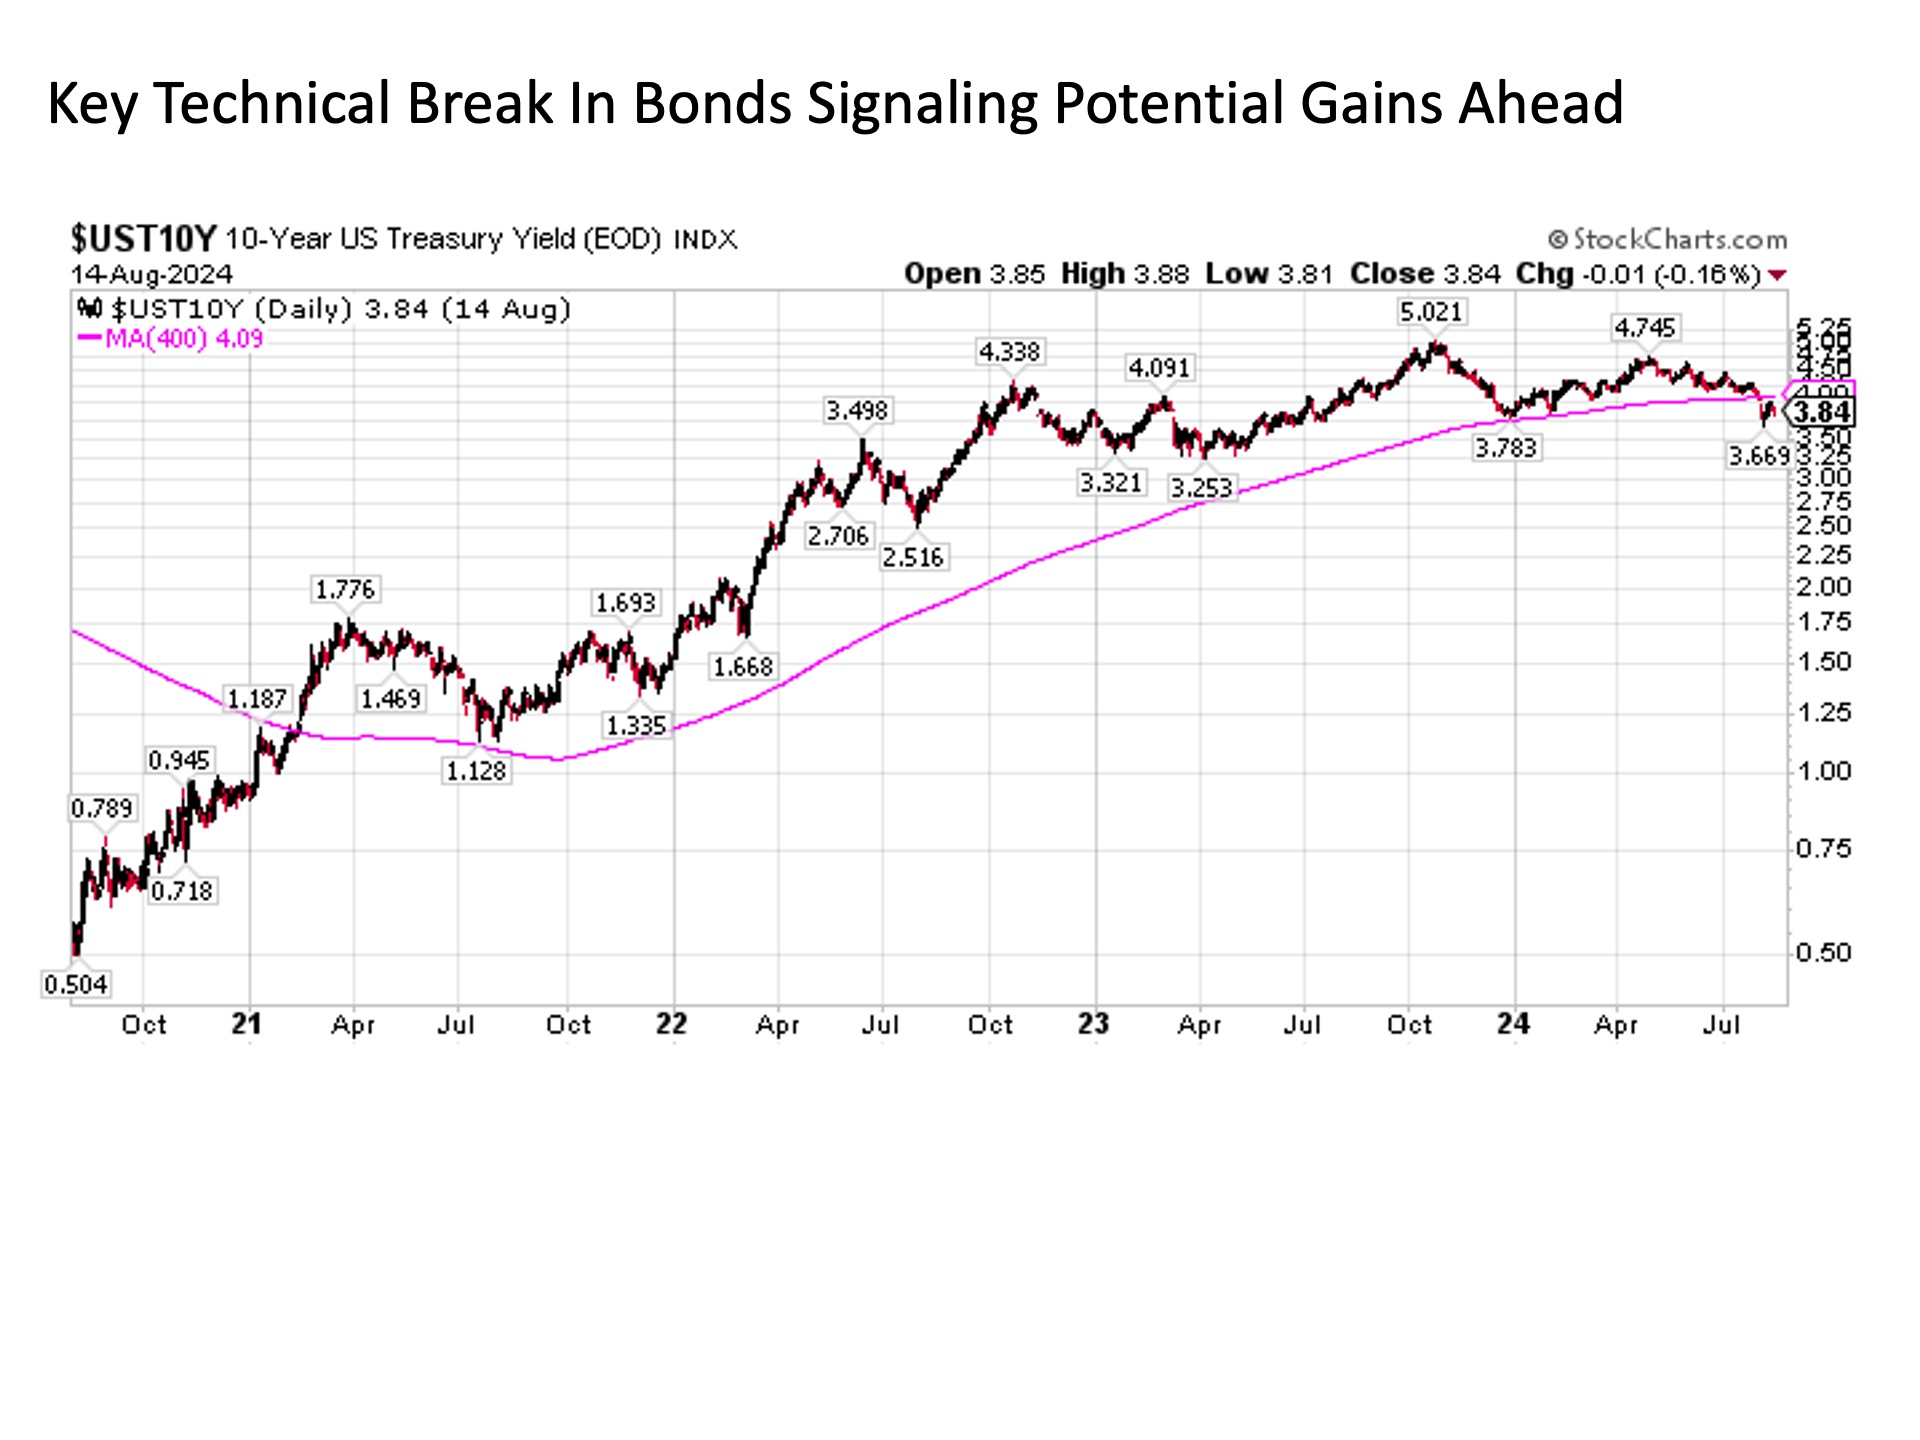
Perhaps more importantly, we have seen an important technical development suggesting further upside for bonds going forward. Overlooked during the stock market plunge at the start of August was arguably a more notable plunge in the 10-Year U.S. Treasury yield (as yields fall, bond prices rise, so this was a notably good thing for bond investors). In the process, the 10-Year Treasury yield fell below its ultra long-term 400-day moving average. Why is this notable? Because a move across this particular trend line historically marks a major change in trend. For example, when the 10-Year U.S. Treasury yield last moved above its 400-day moving average in February 2021, this coincided with the very beginning of the inflationary outbreak that not only saw yields spike as high as 5% but the U.S. stock market fall into a bear market a year later. Thus, the fact that the 10-Year yield has fallen below this key technical level signals investor conviction that the inflation battle is largely over and that focus is turning toward the long anticipated Fed rate cuts finally starting to come to pass.
Gold. Another more specialized category in the asset allocation mix that has been registering stellar returns for quite some time now is gold. With inflationary pressures seemingly continuing to ease and the U.S. Federal Reserve poised to start lowering interest rates as soon as September, the gold market has been glistening for some time now.

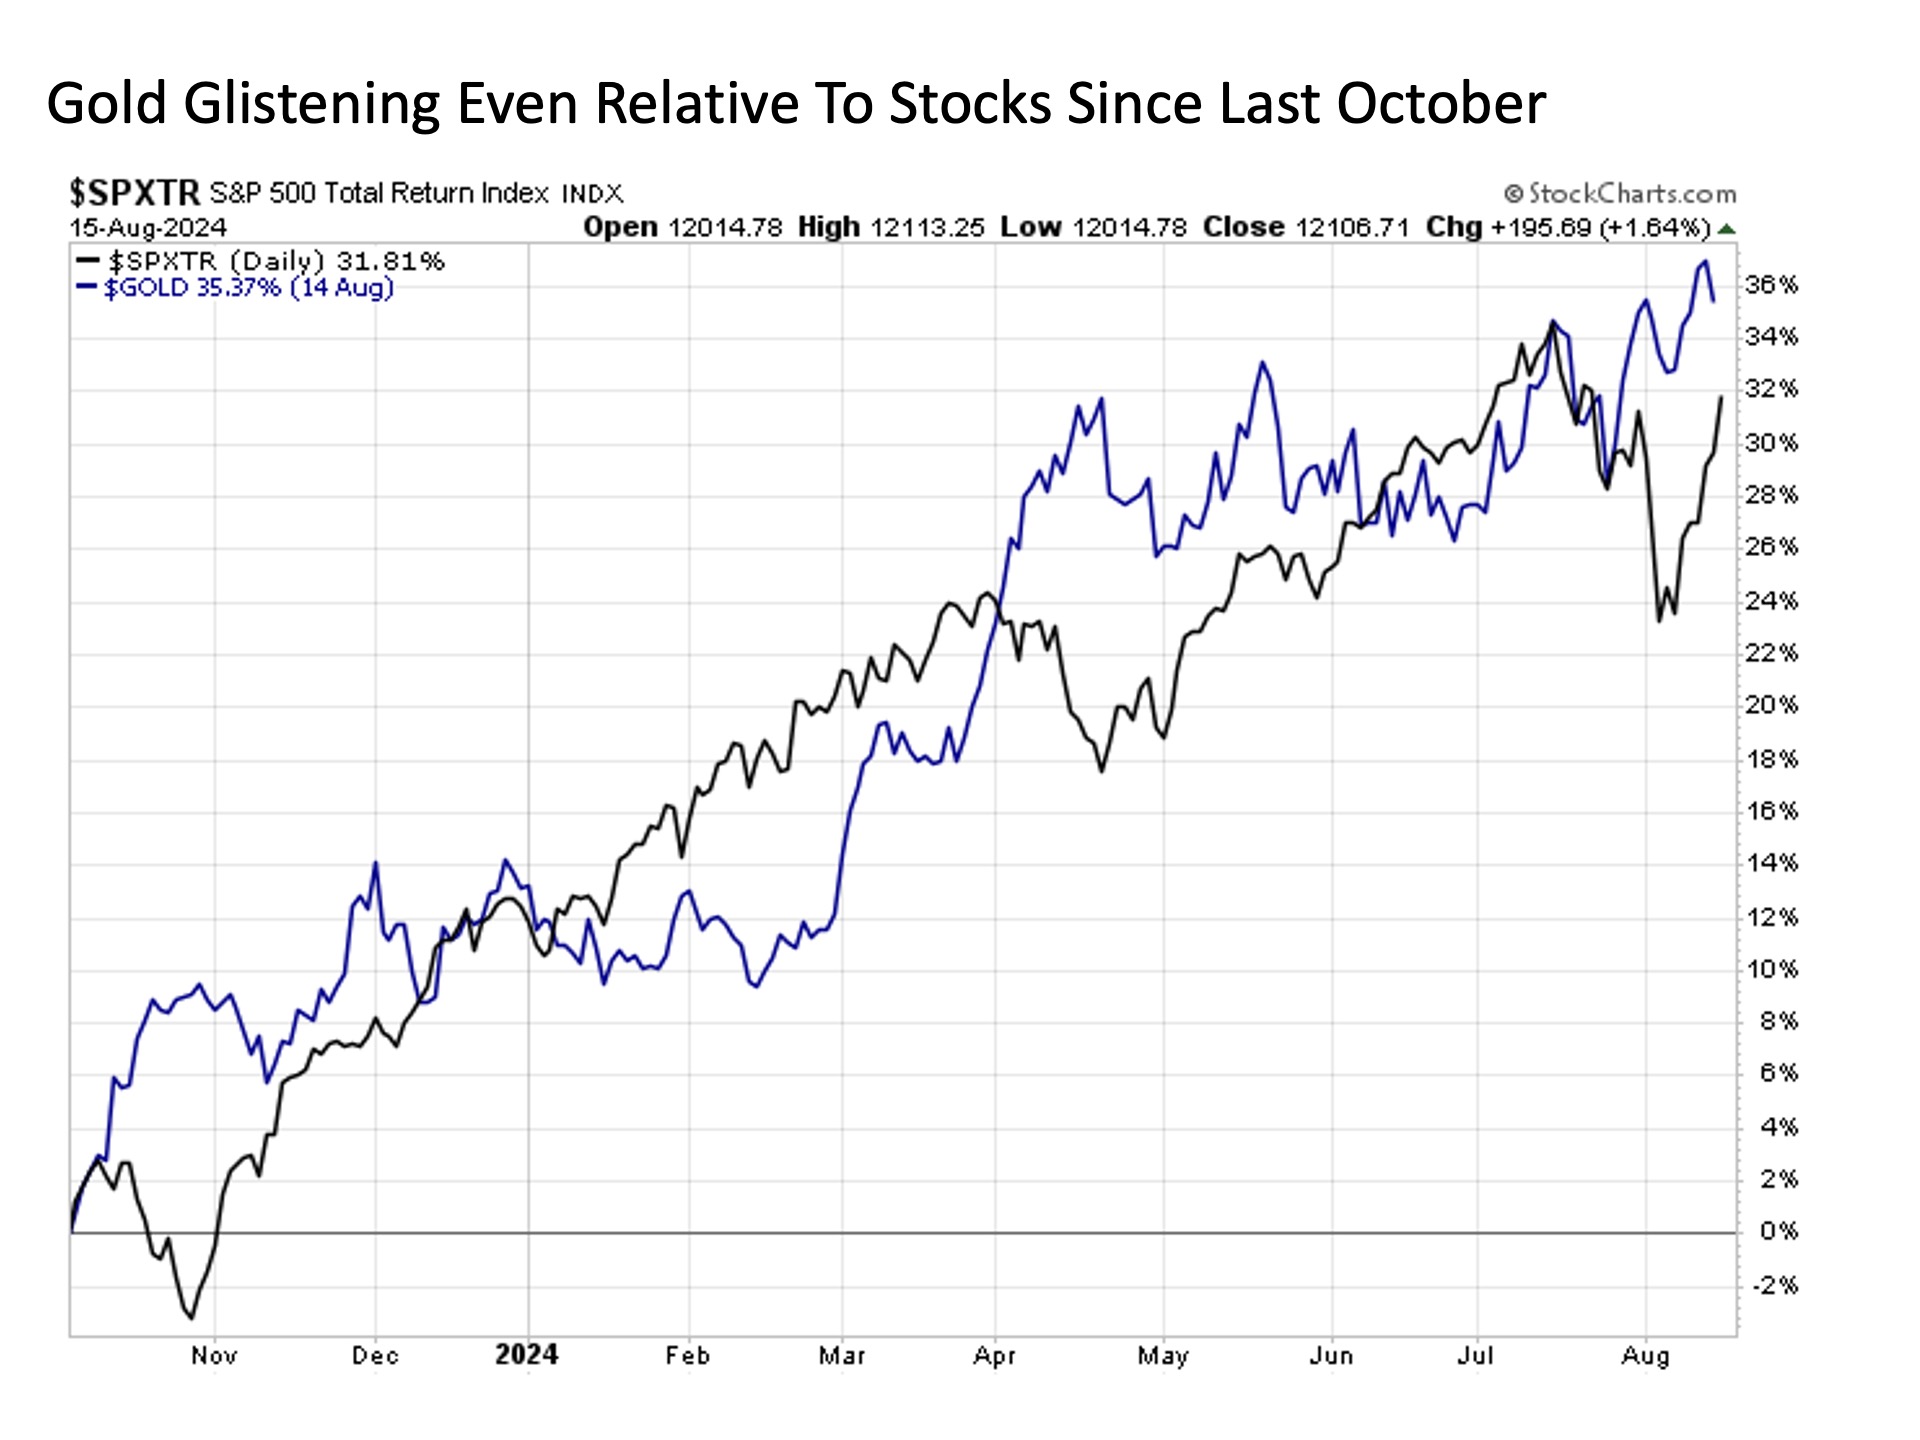
In fact, if one looks back over nearly the past year since early October, we see that gold has actually outperformed the S&P 500, registering a 35% return outperforming the S&P 500 by more than three percentage points. Not too shabby for a barbarous relic.
Bottom line. While stocks dominate the spotlight, it’s worth noting the strong performances from the supporting cast. And this includes both bonds and gold, which have been delivering in their own right along with the diversification benefit of lowering overall portfolio risk.
I/we have no stock, option or similar derivative position in any of the companies mentioned, and no plans to initiate any such positions within the next 72 hours. I wrote this article myself, and it expresses my own opinions. I am not receiving compensation for it. I have no business relationship with any company whose stock is mentioned in this article.
Investment advice offered through Great Valley Advisor Group (GVA), a Registered Investment Advisor. I am solely an investment advisor representative of Great Valley Advisor Group, and not affiliated with LPL Financial. Any opinions or views expressed by me are not those of LPL Financial. This is not intended to be used as tax or legal advice. All performance referenced is historical and is no guarantee of future results. All indices are unmanaged and may not be invested into directly. Please consult a tax or legal professional for specific information and advice.
Compliance Tracking #: 616854-1
